Key takeaways
- Judge rental performance on six numbers, not on whether money arrived this month.
- Economic occupancy (rent collected / rent scheduled) beats physical occupancy, because it counts short payments and concessions.
- Days vacant per turnover is the number that moves cash most; a turnover typically costs one to two months of rent, about $2,000 to $5,000 on a typical Tarrant County home.
- Net per door strips out financing, so it compares houses fairly; return on equity decides hold or sell.
- One row per property per quarter is enough; with a manager most of the data is already in the owner portal.
Six numbers tell you whether a rental is performing: economic occupancy, days vacant per turnover, maintenance as a share of rent, renewal rate, net per door and return on equity. For a single-family home in Fort Worth, Keller or North Richland Hills, all six come from a year of owner statements. Most owners judge a rental by one number instead, whether money showed up this month, and that number hides almost everything.
A house can deposit cash every month while losing a month of rent at each turnover, spending too much on repairs, running below market rent and earning less on its equity than a savings account. This guide defines each number, works it through one illustrative house, and explains what to do when one drifts.
Why cash flow alone is not a performance measure
Cash flow is a result. It is what is left after occupancy, rent level, maintenance, turnover and financing have all done their work, and it moves for reasons that have nothing to do with how the property is run. A rate change on an adjustable loan, a property tax reassessment or a hail deductible can swing it without a single tenant or vendor decision changing.
Performance measures look at the pieces instead. Each one isolates a decision the owner or the manager controls: how fast the house re-rents, how long tenants stay, how much the house costs to keep up, how much of the scheduled rent actually lands. When cash flow drops, the pieces tell you why. When cash flow looks fine, the pieces tell you whether it will stay that way.
Use a full year of statements for each measure. A single month is weather; a year is climate.
The six rental performance numbers at a glance
Each number below uses the same illustrative house: a $2,000-a-month rental in Tarrant County with one turnover in the year. The figures are examples, not market data:
| Number | Formula | Illustrative result | If it drifts, check |
|---|---|---|---|
| Economic occupancy | Rent collected / rent scheduled | $21,500 / $24,000 = about 90% | Vacancy length, unpaid rent, concessions |
| Days vacant per turnover | Keys returned to new lease start | 30 days (one month of rent) | Make-ready, pricing, screening speed |
| Maintenance ratio | Repairs and upkeep / rent collected (no capital items) | $1,900 / $21,500 = about 9% | Invoices, vendor pricing, aging systems |
| Renewal rate | Renewals / leases that ended | 0 of 1 this year | Increase size, renewal timing, repair history |
| Net per door | Rent collected minus operating costs and reserve, before the mortgage | $14,000 a year, about $1,170 a month | Insurance, taxes, HOA, maintenance ratio |
| Return on equity | Net after the mortgage / equity if sold today | Compare with what the equity could earn elsewhere | Hold, refinance or sell decision |
How to read this table: read the first five rows as operations and the last as an investment decision. A drop in any of the first five has a cause a manager can name from the invoices and the lease file; a falling return on equity in a well-run house usually means the equity has grown, not that anything went wrong.
Economic occupancy: rent collected divided by rent scheduled
Physical occupancy asks whether someone lives there. Economic occupancy asks whether the rent arrived. Take the rent actually collected over twelve months and divide it by the rent that would have been collected if the house had been full and paid in full every month at the lease rate.
Say the lease rent is $2,000 a month, so scheduled rent for the year is $24,000. The house sat empty for one month during a turnover and a tenant short-paid by $500 one month that was never recovered. Collected rent is $21,500. Economic occupancy is just under 90 percent. That is a full month and a half of rent that never arrived, which cash flow alone would show as a vague "slow year."
What moves it: vacancy length, uncollected rent, concessions given to lease the house, and rent below market that caps the scheduled number in the first place. A vacant month is the biggest single hit most owners take in a year, which is why the next number matters so much.
Here is the difference between the two kinds of occupancy for the same house and year:
| Measure | Question it answers | Formula | Illustrative house |
|---|---|---|---|
| Physical occupancy | Was someone living there? | Occupied days / days in the year | 335 / 365 = about 92% |
| Economic occupancy | Did the rent actually arrive? | Rent collected / rent scheduled | $21,500 / $24,000 = about 90% |
How to read this table: physical occupancy looks better because it ignores the $500 short payment that was never recovered. When the two numbers drift apart, the problem is collection or concessions, not vacancy.
Days vacant per turnover
Count from the day the outgoing tenant hands over keys to the day the new tenant's lease starts. Include the make-ready, the marketing and the application period. Track it per turnover, not per year, so you can see whether each one is getting faster or slower.
Break it into its parts, because each has a different fix:
- Make-ready days. Driven by how quickly the walkthrough happens, how fast vendors are scheduled and whether work is done in parallel. A tight make-ready has the walkthrough the day keys come back and vendors scheduled before the tenant has left the driveway.
- Marketing days. Driven by pricing, photos and listing reach. A house that sits with few showings is usually priced wrong; one with many showings and no applications usually has a presentation or condition problem.
- Application-to-move-in days. Driven by screening speed and the applicant's own timeline.
Pre-leasing, which means marketing while the current tenant is still in place, can take the marketing days down to near zero. Ask how your manager handles it, and compare each turnover to the last.
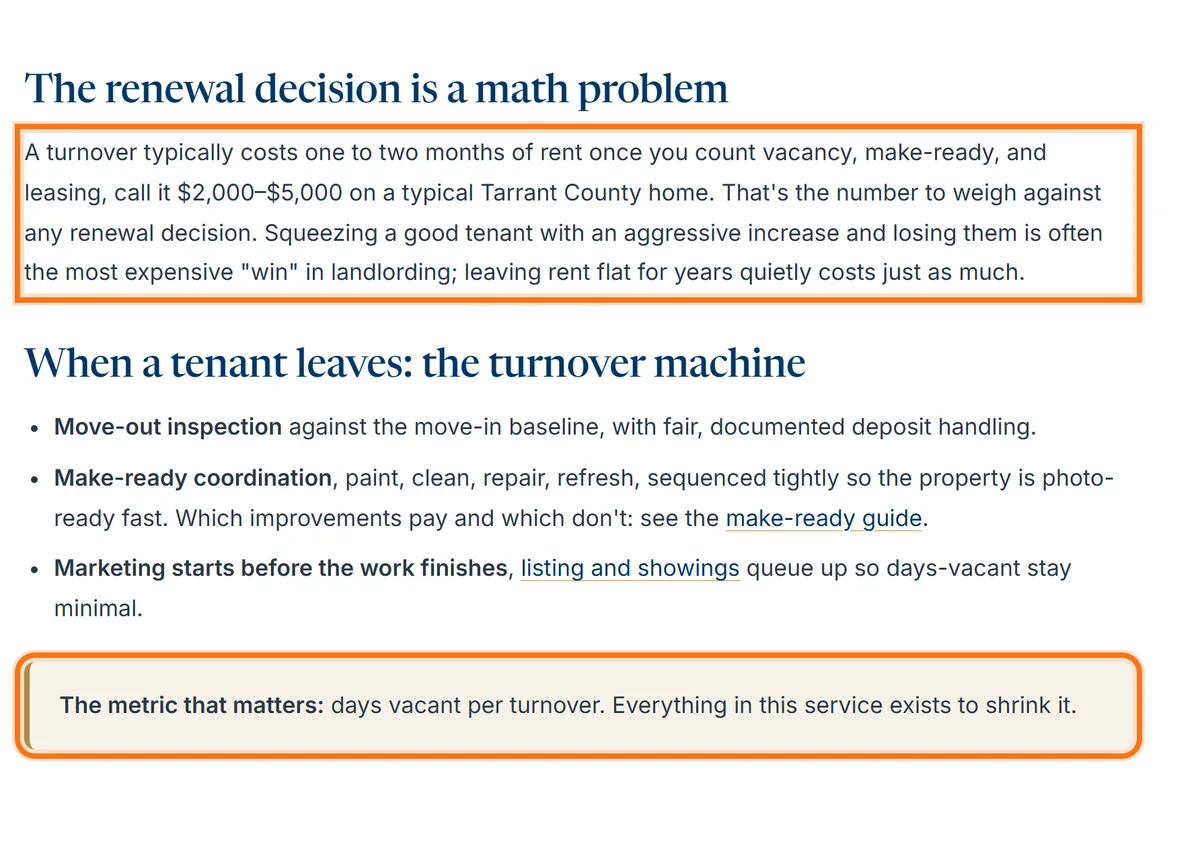
Two of our written guarantees attack this number directly: a market-ready home is live on every major rental platform within 5 business days or the first month's management fee is waived, and while a home is vacant the owner gets a written activity report every week with showing feedback.
Maintenance ratio: repairs and upkeep as a share of rent
Add up everything spent on repairs, routine maintenance and make-ready work for the year, excluding capital improvements such as a roof or an HVAC replacement, and divide it by the rent collected. That share is the maintenance ratio. Track it as a trend rather than against a universal benchmark, because an older house in a hot climate will run higher than a newer one, and both can be well managed.
What to look for:
- A rising ratio with the same tenant suggests aging systems, deferred items catching up or a vendor problem.
- A spike in a turnover year usually means the make-ready absorbed damage that should have been charged to the deposit or caught by inspections.
- A very low ratio over several years is not always good news. It can mean maintenance is being deferred and will arrive all at once.
Keep capital items in a separate line so they do not distort the ratio, and check whether any markup sits on top of vendor invoices, so the ratio reflects the work and not a fee on top of it. Perpetual's maintenance process puts every invoice in the portal so the number can be checked line by line.
Renewal rate and average tenant tenure
For a single property, the renewal rate is simply whether the tenant renewed at the end of each lease. Across a few properties or a few years, it becomes a share: renewals divided by lease expirations. Average tenure is how long each tenant stayed. Together they tell you how much turnover you are generating and whether the rent increases, the maintenance response and the communication are keeping good tenants or pushing them out.
A renewal is worth more than most owners credit. It avoids the make-ready, the marketing, the vacancy and the leasing cost, and it keeps a tenant whose payment history you already know. A property with a high renewal rate can accept a slightly lower rent increase and still outperform one that turns over every year at full market rent.
If the rate is low, look at the renewal timing, the size of the increases and the repair history in the last six months of each lease. Those three explain most non-renewals. The guide to keeping good tenants covers the fixes, and Perpetual's renewal process starts the conversation early enough to act on them.
Net per door: what the house actually earned
Net per door is the annual income after every operating expense, including management, maintenance, insurance, taxes, HOA dues, a vacancy allowance and a contribution to reserves, but before the mortgage. Divide by twelve for a monthly figure. It is the cleanest comparison between properties, because it strips out how each one is financed.
Using the illustrative house above: $21,500 collected, less, say, $7,500 in operating expenses and reserves, leaves $14,000 for the year, or roughly $1,170 a month net per door. Compare that against the house down the street or the one you are thinking of buying, and the differences in expense load and rent level become obvious in a way that cash flow never shows.
Track it every year and watch the trend. A flat net per door while rents in the area rise means expenses are eating the increases, and the maintenance ratio and the vacancy number will usually say which.
Return on equity: the number that decides hold or sell
Net per door tells you what the house earns. Return on equity tells you whether it earns enough for the money tied up in it. Take the annual net after the mortgage and divide it by the equity you would walk away with if you sold today, after paying off the loan and selling costs.
This number falls as a property appreciates and the loan pays down, even when the house is run perfectly. That is not a management failure; it is the signal that the equity has grown faster than the income it produces. The rental return guide walks through the full calculation with a worked example, and the hold-or-sell decision follows from it.
How to track all six without building a spreadsheet empire
One tab per property, one row per quarter, six columns. Fill it from the owner statements and the lease file. The quarterly cadence is deliberate: monthly is noise, annual is too late to act.
- Pull the quarter's statements and update rent collected and scheduled.
- Record any turnover with its three day counts.
- Total maintenance for the quarter, capital items separately.
- Note any renewal or non-renewal and the tenant's tenure.
- Once a year, compute net per door and return on equity.
With a manager, most of this is already in the portal. Perpetual's owner portal holds the statements, invoices, lease dates and inspection reports, so the quarterly update is reading, not reconstruction. If you self-manage, the same numbers come from your bank statement, your lease file and your receipts, and the bookkeeping basics guide describes how to keep them in a form you can total.
What to do when one number moves
Each measure points to a specific conversation.
- Economic occupancy falls: ask about rent collection enforcement, concessions and whether the rent is at market.
- Days vacant rise: ask which of the three phases grew and why, and whether pre-leasing was attempted.
- Maintenance ratio climbs: ask for the invoice detail, the vendor list and the inspection reports, and separate aging systems from vendor pricing.
- Renewal rate drops: ask about increase size, renewal timing and the repair history before each non-renewal.
- Net per door flattens while rents rise: look at insurance, taxes and HOA dues first, then the maintenance ratio.
- Return on equity sinks: that is a hold-or-sell question, not an operations one.
A good manager will have these answers ready, because they watch the same numbers across every door they manage. If you want to see how your property measures up before changing anything, a free rental analysis gives you the market rent to start from.
The takeaway: Cash flow tells you what happened; the six numbers tell you why, and they fit on one row of a spreadsheet per quarter.
Questions owners ask
What is a good occupancy rate for a single rental property?
For one house, think in days rather than percentages: every vacant day is lost rent. Economic occupancy, rent collected divided by rent scheduled, is the better measure because it also captures short payments and concessions. Over a year, a well-run single-family rental should lose little beyond the turnover itself.
How do I calculate net operating income on a rental?
Take the rent collected for the year and subtract every operating expense: management, maintenance, insurance, property taxes, HOA dues, utilities you pay, a vacancy allowance and a reserve contribution. Do not subtract the mortgage. The result is net operating income, or net per door when you compare across properties.
How much should maintenance cost on a rental property each year?
It depends on the age, size and systems of the house, so track the ratio of maintenance to rent as a trend rather than against a universal benchmark. A rising ratio with the same tenant, or a spike at turnover, is the signal to look at invoices, vendors and inspection reports.
What is the most important metric for a rental property?
No single one. Economic occupancy and days vacant show whether income is arriving, maintenance ratio and renewal rate show whether the property is being run well, and net per door and return on equity show whether it is worth holding. Review all six quarterly and act on the first one that drifts.
What is the difference between physical and economic occupancy?
Physical occupancy measures whether the home was lived in: occupied days divided by days in the year. Economic occupancy measures whether the rent arrived: rent collected divided by rent scheduled at the lease rate. Economic occupancy is the better performance number because it also counts short payments, unpaid balances and move-in concessions.
How can I track occupancy and revenue across all my rentals?
Keep one row per property per quarter with rent scheduled, rent collected, days vacant, maintenance spent and any renewal. With Perpetual, statements, invoices and disbursement history sit in the AppFolio owner portal, and per-door reporting shows each home on its own numbers, so the quarterly update is reading rather than rebuilding.
Related services
Property management in Keller, North Richland Hills and Fort Worth. How full-service management works in Tarrant County →